Compartir
Easy r: Access, Prepare, Visualize, Explore Data, and Write Papers (en Inglés)
Elizabeth A. Gohmert; Quan L. Li; Douglas R. Wise (Autor)
·
Sage Pubn
· Tapa Blanda
Easy r: Access, Prepare, Visualize, Explore Data, and Write Papers (en Inglés) - Elizabeth A. Gohmert; Quan L. Li; Douglas R. Wise
$ 44.680
$ 81.240
Ahorras: $ 36.560
Elige la lista en la que quieres agregar tu producto o crea una nueva lista
✓ Producto agregado correctamente a la lista de deseos.
Ir a Mis Listas
Origen: Reino Unido
(Costos de importación incluídos en el precio)
Se enviará desde nuestra bodega entre el
Martes 09 de Julio y el
Miércoles 17 de Julio.
Lo recibirás en cualquier lugar de Chile entre 1 y 3 días hábiles luego del envío.
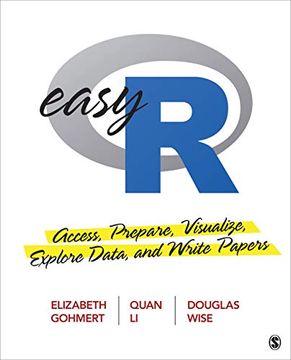
Reseña del libro "Easy r: Access, Prepare, Visualize, Explore Data, and Write Papers (en Inglés)"
Do you want to learn R? This book is built on the premise that anyone with a bit of free time and a healthy curiosity can learn to use R in their studies or at work. The authors focus on using R to do useful things like writing reports, creating data and graphs, accessing datasets collected by others, preparing data, and conducting simple data analysis. In this book you’ll learn how to: install R and RStudio®, and set up an RStudio® project and folders; write an essay with graphs based on simple real-world data using R Markdown; create variables from everyday numeric information and visualize data through five types of charts―bar plot, histogram, pie chart, scatter plot, and time series line plot―to identify patterns in the data; write and run R programs, and prepare your data following the tidyverse approach; import external datasets into R, install R data packages, and carry out initial data validity checks; conduct exploratory data analysis through three exercises involving data on voting outcomes, natural resource consumption, and gross domestic product (GDP) via data visualization, correlation coefficient, and simple regression; and write a research paper on the impact of GDP per capita on life expectancy using R Markdown. Student-friendly language and examples (such as binge-watched shows on Netflix, and the top 5 songs on Spotify), cumulative learning, and practice exercises make this a must-have guide for a variety of courses where data are used and reports need to be written. Code and datasets used to carry out the examples in the book are available on an accompanying website.

